具体制作过程如下:
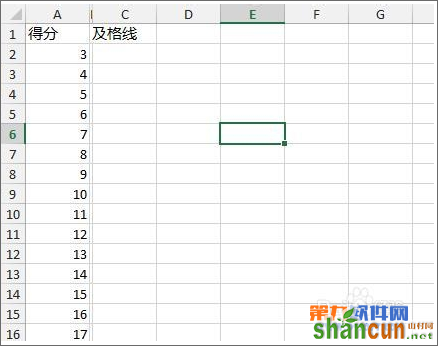
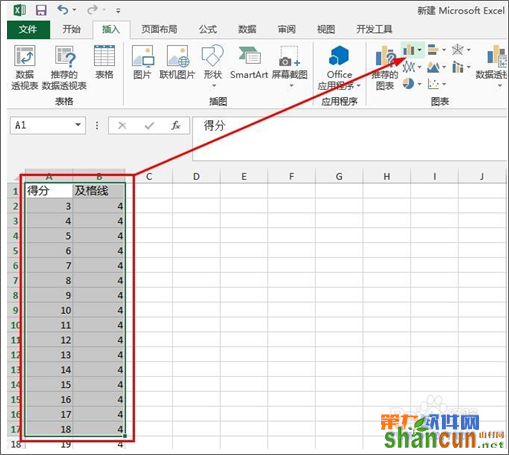
1、我们本来要绘制的柱形图只有一列数据,也就是得分这一列数据,为了画基准线,我们增加一个及格线
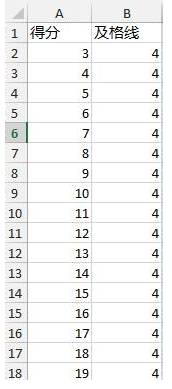
2、假如及格线都是4,我们快速填充好
3、选中两列数据,添加柱形图
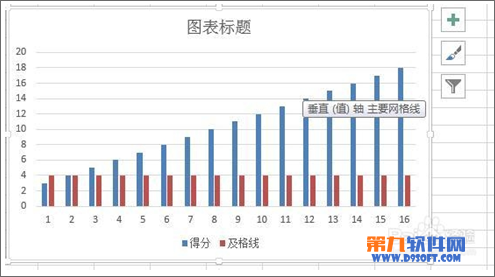
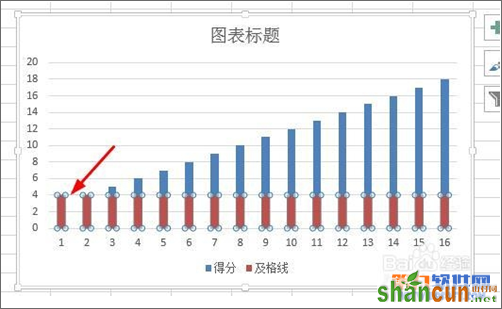
4、插入的柱形图是酱紫的
5、我们点击蓝色的柱子,然后右键单击,从菜单中选择【设置数据系列格式】
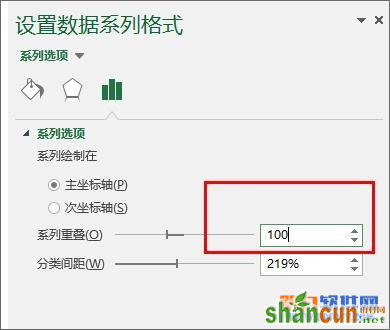
6、在右侧打开一个对话框,我们设置系列重叠为百分之百
7、现在图变成了这个样子
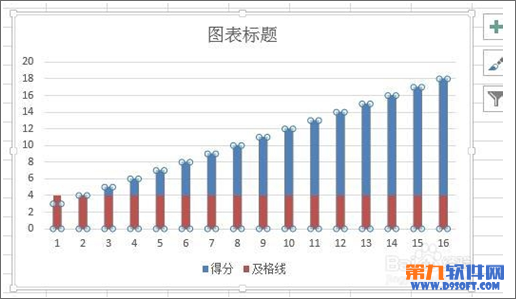
8、接着选中红色的柱子
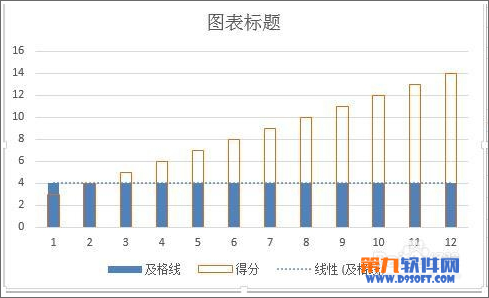
9、在右侧的属性窗口设置:填充为无,边框为实线,设置一下边框颜色
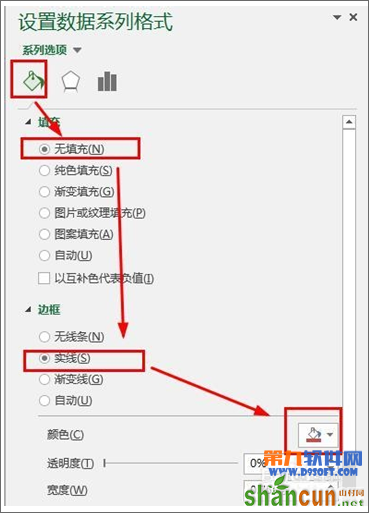
10、现在变成了酱紫
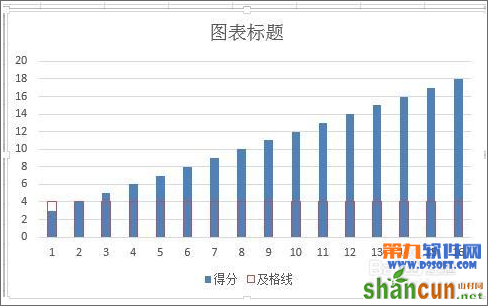
11、接着我们还是选中红色柱子
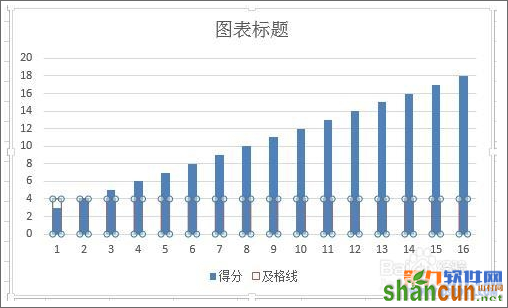
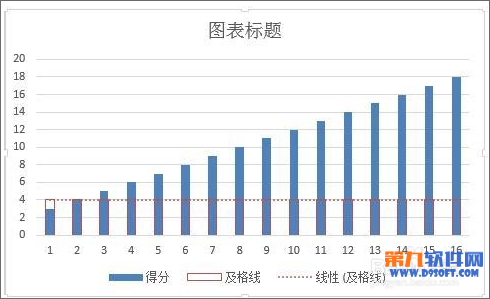
12、右键单击,然后选择【添加趋势线】
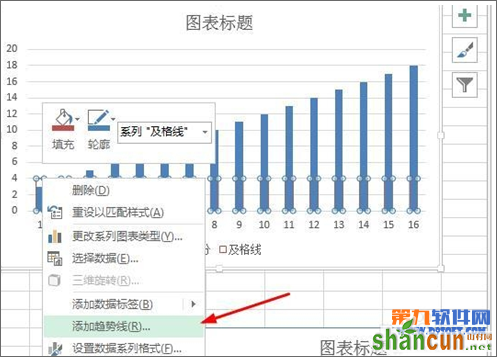
13、出来的效果图就是酱紫了。