
Excel 2010版新增的 “迷你图”功能,可以在一个单元格里面制作走势表。案例阐述了如何通过“迷你图”将各个月份的数据走势通过多种“迷你图”在单元格里面表现出来。
①启动Excel2010,导入需要处理的电子表格,选中H3:H11区域,单击菜单栏--插入--迷你图--柱形图。
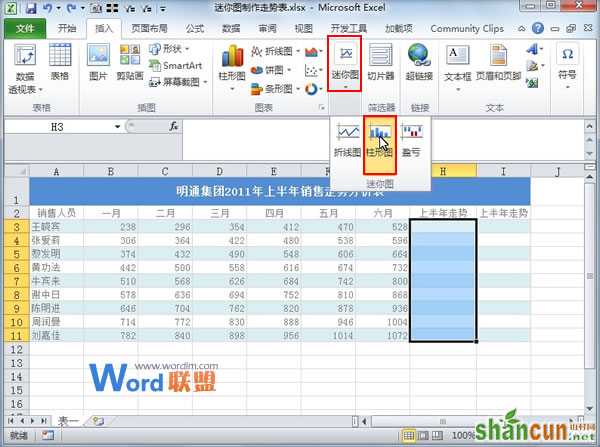
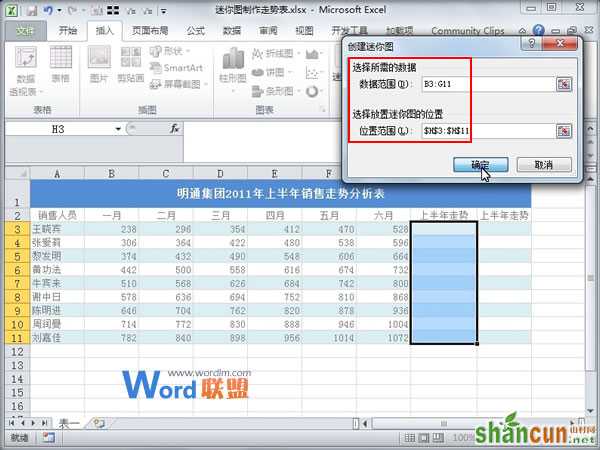
②弹出创建迷你图对话框,选择数据范围,以及放置迷你图的位置,单击确定。
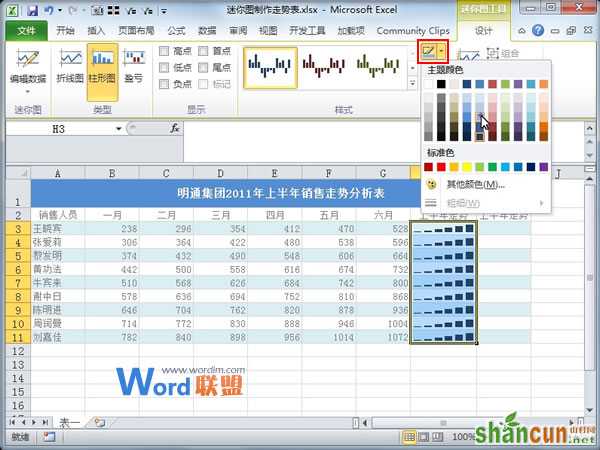
③迷你图插入完成,我们选中,单击设计选项卡下颜色按钮,改变颜色为蓝色。
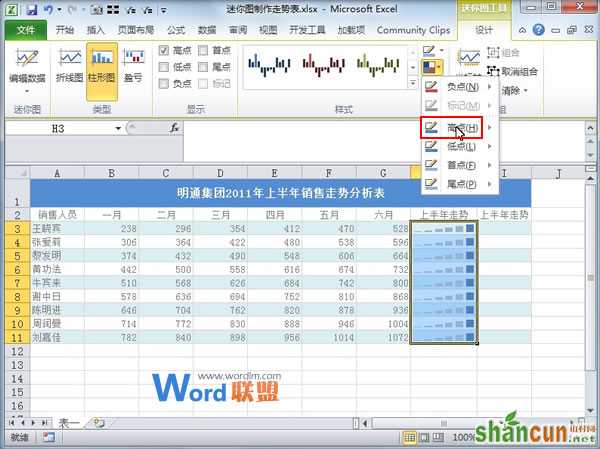
④继续在设计选项卡中,选择“高点”。
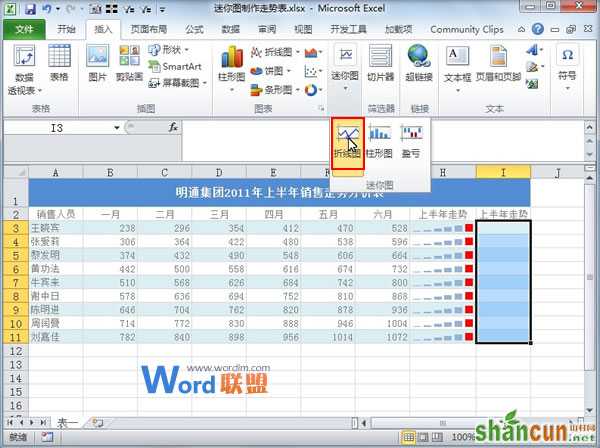
⑤选择I3:I11区域,单击菜单栏--插入--迷你图--折线图。
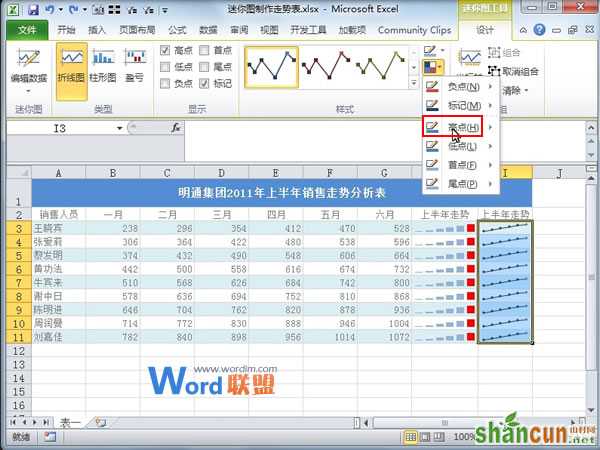
⑥同样的,将其设置为“高点”。
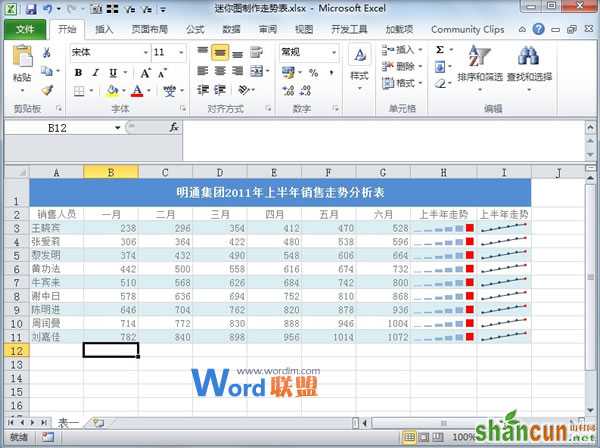
⑦最后,H列显示的是迷你图,I列显示的是走势图,这样就利用了迷你图完成了走势图的制作。
注:更多精彩教程请关注山村电脑教程栏目,山村办公群:185219299欢迎你的加入


