Excel报表怎么格式化
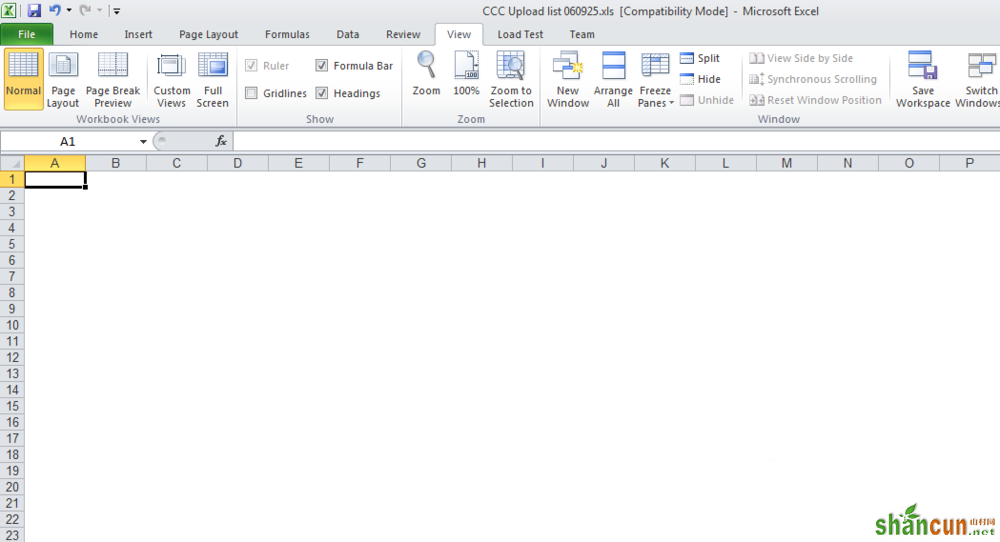
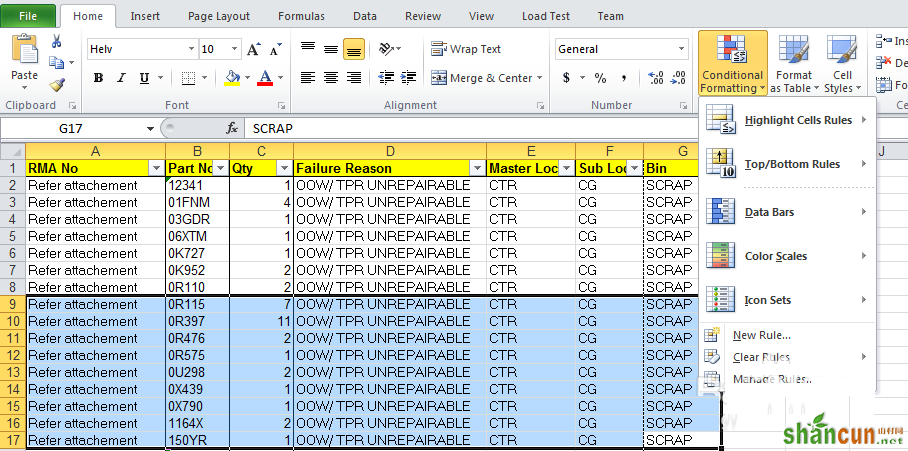
1.打开Excel,选中要格式的区域。
2.这里,我们先介绍Conditional formatting(条件格式化)。
3.Hightligh Cell Rules。这里面有好多条件供我们选择,比如我们选择granter than
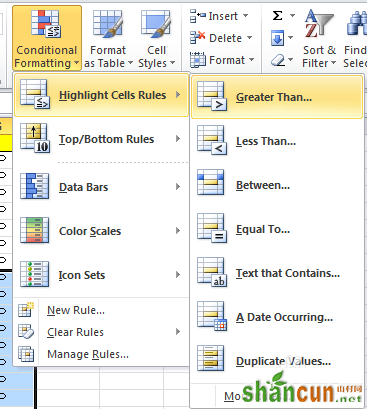
4.这时会弹出设置面板,我们可以设置大于多少会被标注颜色。
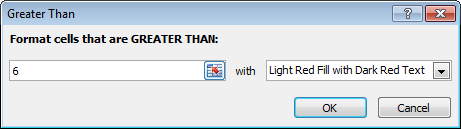
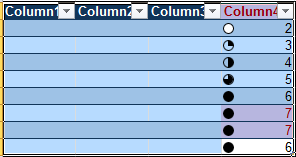
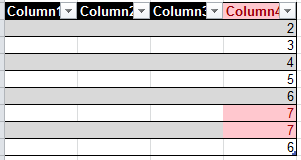
5.我们选择大于6的标注,效果如下图。其他的功能也同样的道理,大家试试吧。
6.Format as table。选中要格式化的内容,点击Format as table,然后选中中意的模板就可以了。
7.附件icon sets举例: