运用好excel制作一份数据分析就成了企业中高层管理者必备的技能之一,下面就为大家介绍excel制作数据分析的三维饼图方法,来看看吧!
步骤:
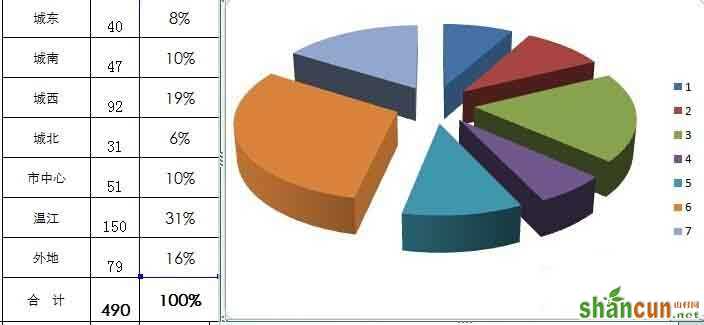
第一步骤也是最基本步骤,先将我们要分析的数据输入excel表中
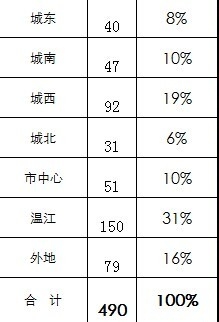
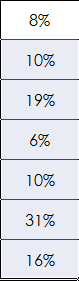
第二步直接选中我们要分析的数据,通过excel鼠标点击第一个数据然后下拉,即可选中该列数据
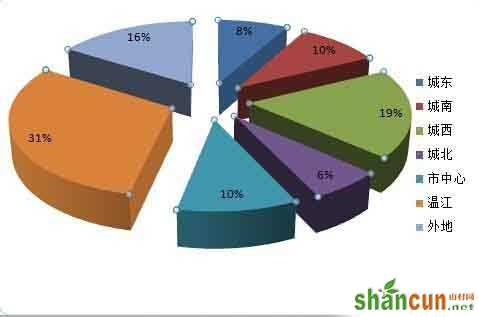
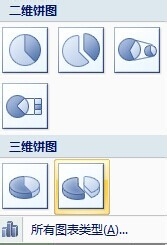
第三步骤选择标题栏上面的插入,饼图三维饼图,即出现图形

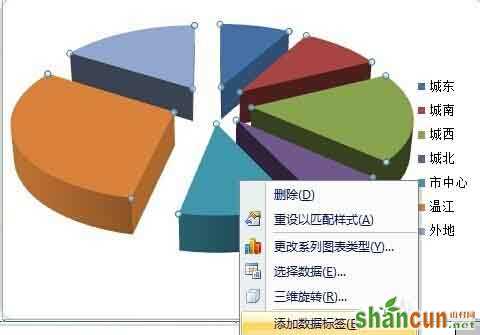
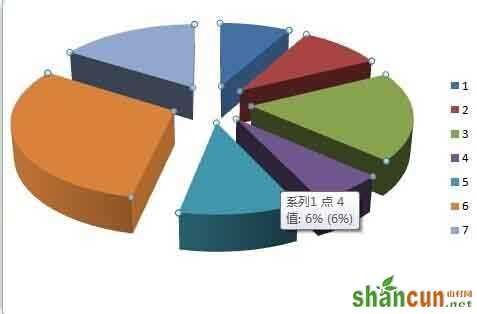
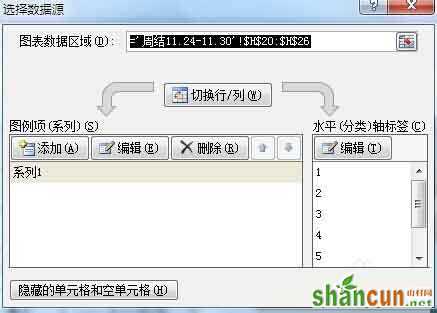
然后用鼠标选择扇形区域,点击右键,选择数据、
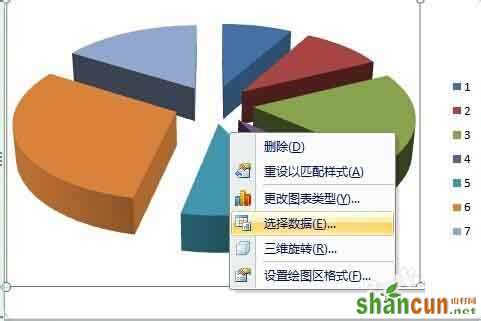
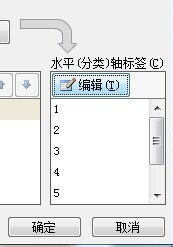
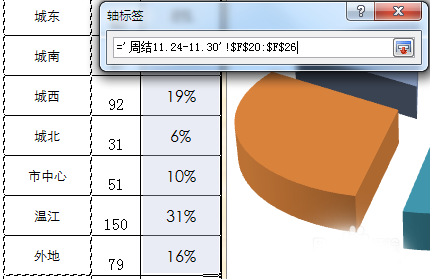
在选择数据中,再选择水平轴标签点击编辑,即可选择列名称数值,点击边框旁边按钮选中应该选名称

选中名称点击确定,在图片右边就出现图表名称
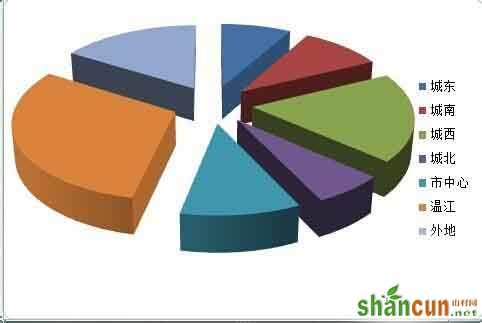
最后选择区域内的图形,点击右键,选择添加数据标签,图片即可完成