excel统计图表的制作方法:
统计图表制作步骤1:EXCEL登场
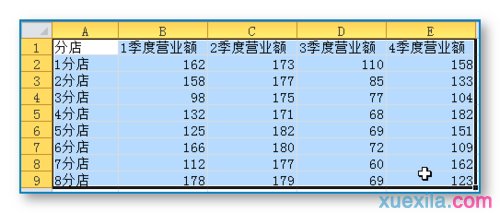
统计图表制作步骤2:准备好要制作图表的基础数据,分店业绩不错啊!
统计图表制作步骤3:全部选中字段和记录(字段指最上面一排不变的即A1-E1单元格,记录指A2-E9的9行)
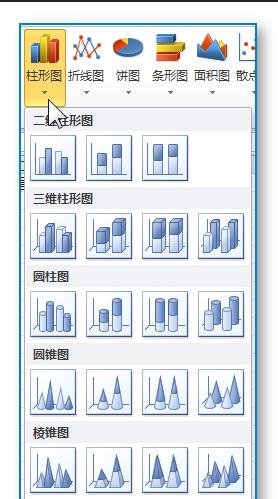
统计图表制作步骤4:点插入
统计图表制作步骤5:点这些都是图表的样式
统计图表制作步骤6:点柱形图,从最简单的开始


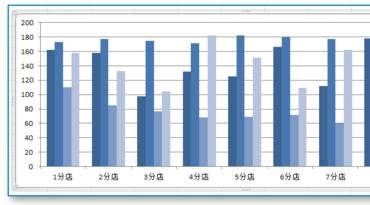
统计图表制作步骤7:系统自动在当前SHEET中生成一个图表。图表横坐标为记录的第一字段,纵坐标为记录其他字段的区间值,而图表中间的图形则是记录的值。
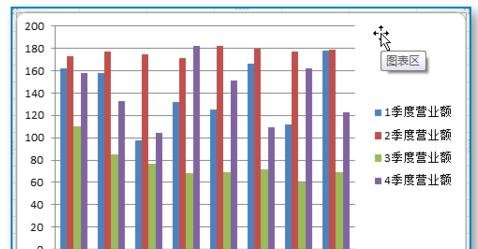
统计图表制作步骤8:鼠标旁有个“十”符号表示按住左键不放可以移动图表
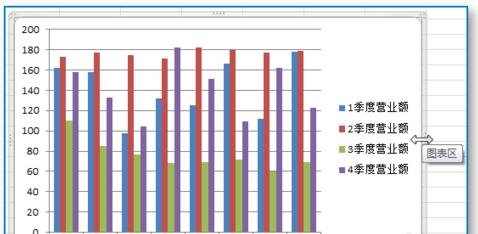
统计图表制作步骤9:鼠标移动到图表左右边缘变成左右箭头表示横向放大图表
统计图表制作步骤10:鼠标移动到图表上下边缘变成上下箭头表示纵向放大图表

统计图表制作步骤11:系统提供很多预定义的图表样式,点击可以直观看到图表效果。

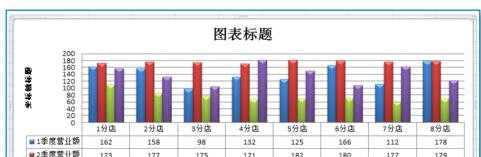
统计图表制作步骤12:选择合适的图表布局
统计图表制作步骤13:图表立即适应当前图表布局
统计图表制作步骤14:就这样,图表就设置好了,当更改记录值的时候,图表内容自动更改。