Word怎么制作条形统计图
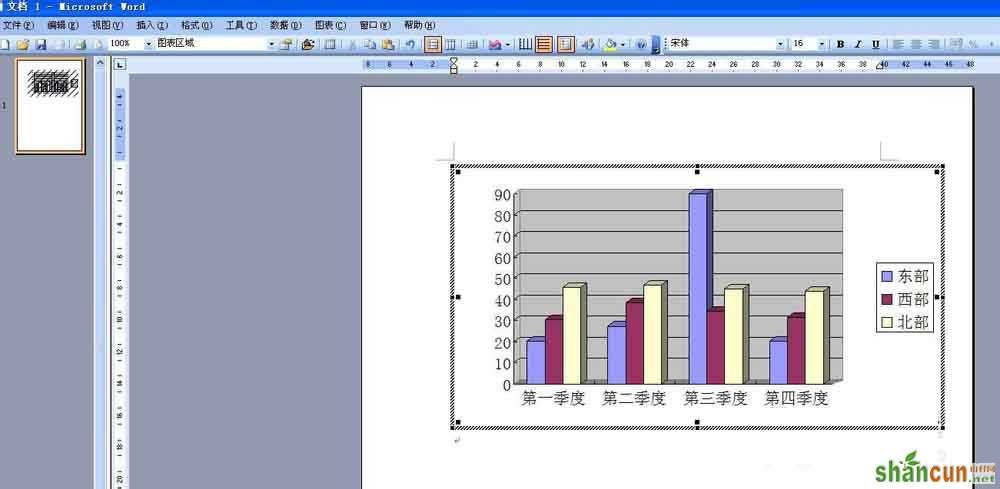
最终效果图:

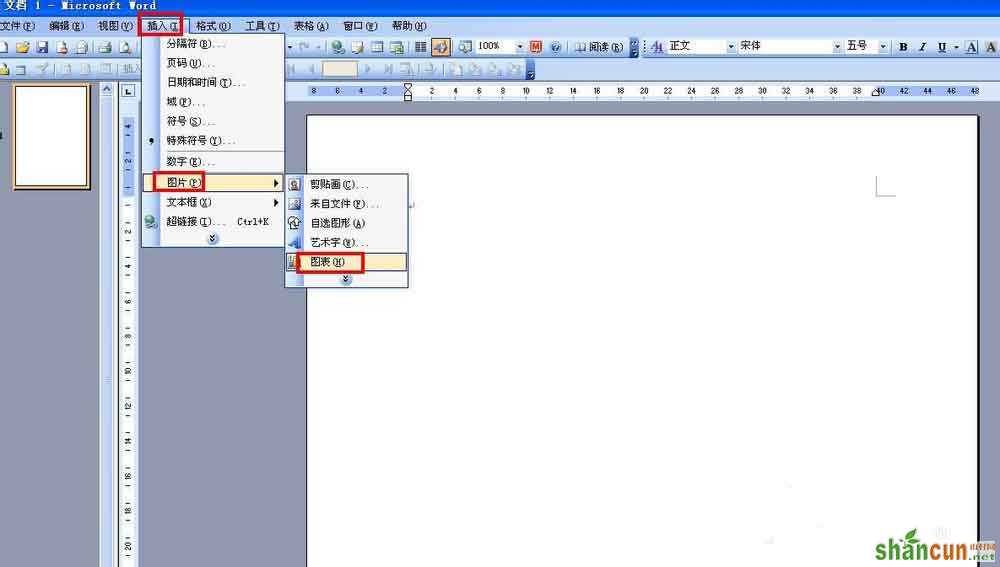
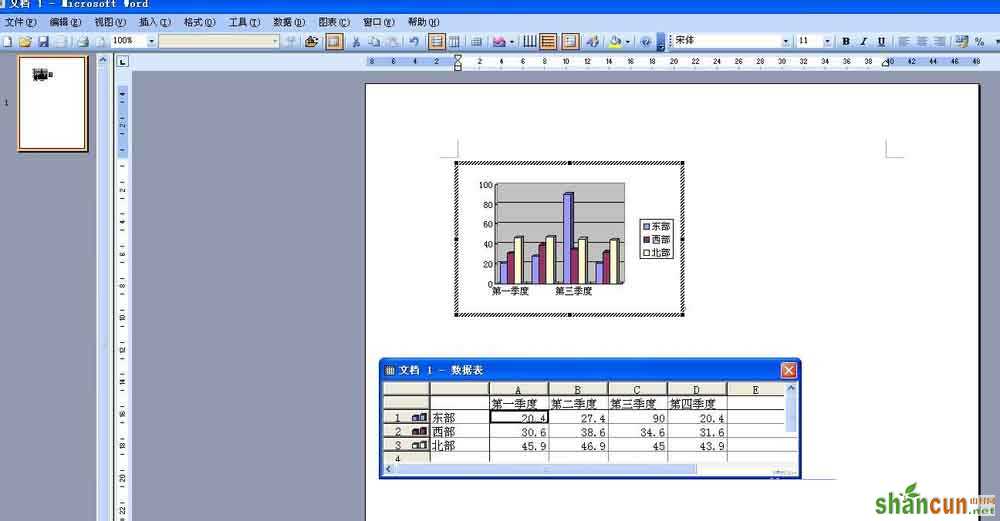
1、新建一个Word文档,单击插入——图片——图表,出现数据表,在数据表中输入数据,关闭对话框。这时候条形图就出现了,调节好条形图大小。
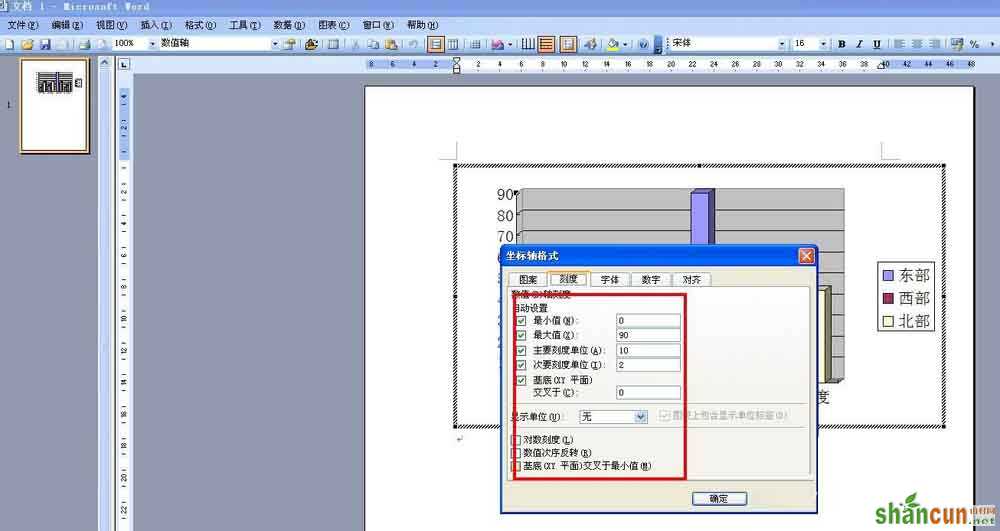
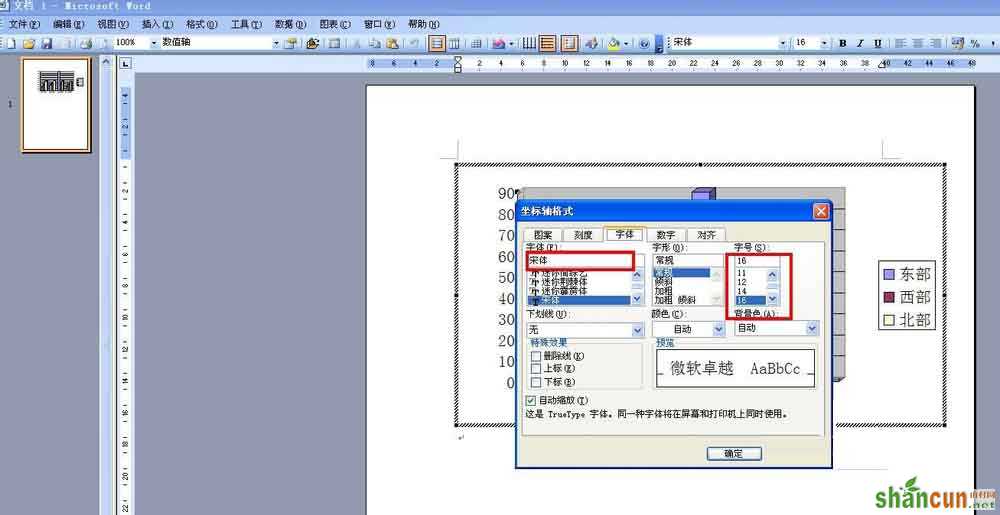
2、双击坐标轴,打开坐标轴对话框,单击图案标签,选择好样式、颜色、粗细,单击刻度标签,调节好刻度大小,单击字体标签,可以调节坐标轴字体,单击数字标签,可以选择数字格式。

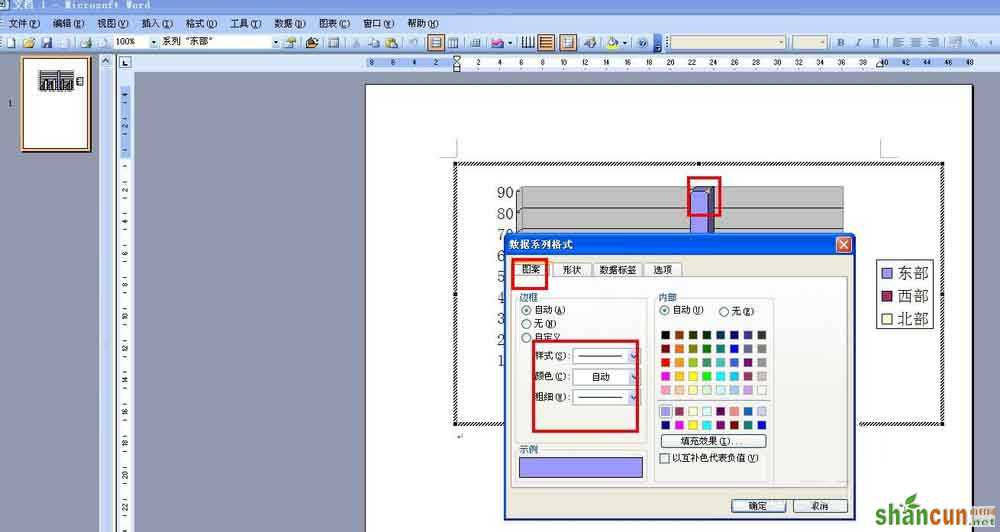
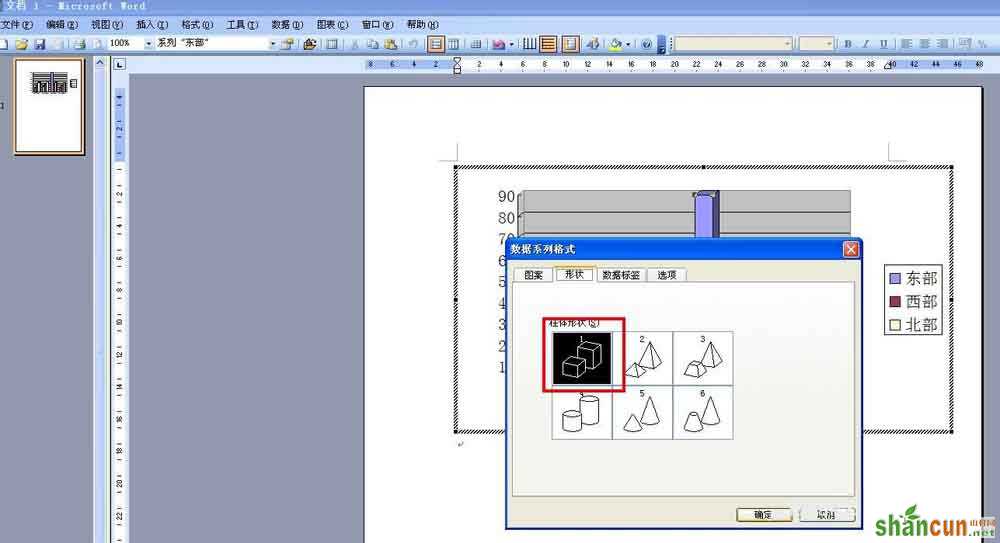
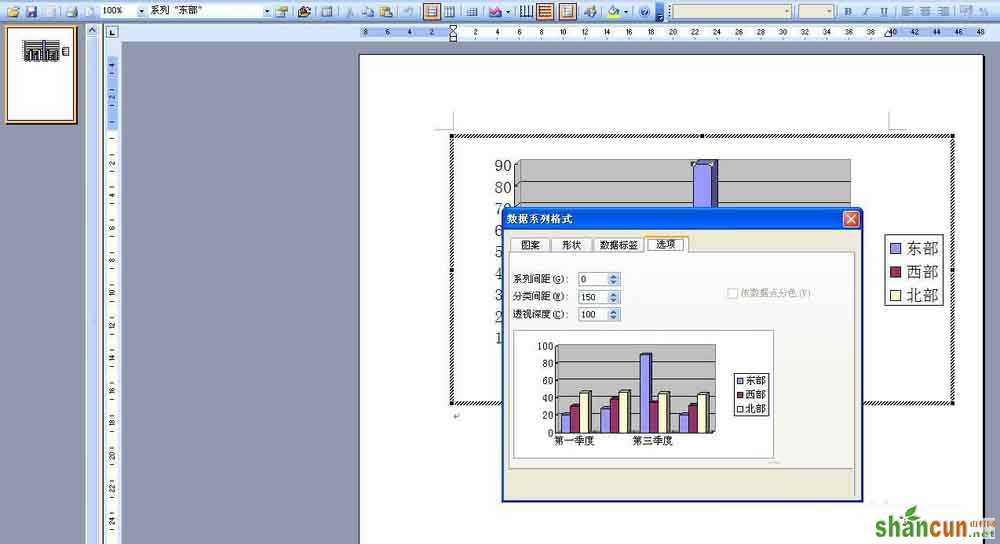
3、双击数据系列,打开数据系列格式对话框,选择图案标签可以改变条形图系列的颜色和线条,选择形状标签,有六种形状可供选择,选择数据标签和选项标签还可以设置一些系列数据格式。现在条形图就制作好了。