Excel表格中,通过插入图表能让我们的数据显得更加直观,看起来一目了然。
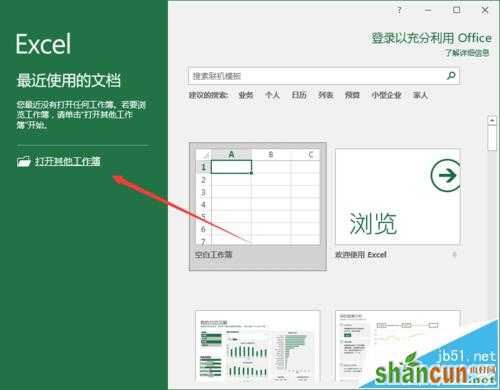
1、鼠标左键双击计算机桌面Excel2016程序图标,将其打开运行。在打开的Excel2016程序窗口,点击“打开其他工作簿”选项,打开需要进行编辑的Excel工作表。如图所示;
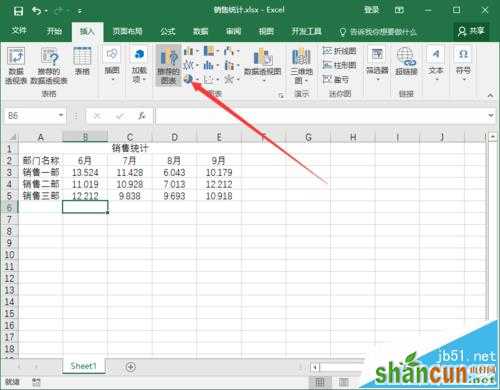
2、在打开的Excel工作薄窗口中,选中需要插入的列单元格位置,并打开“插入”菜单选项卡。如图所示;
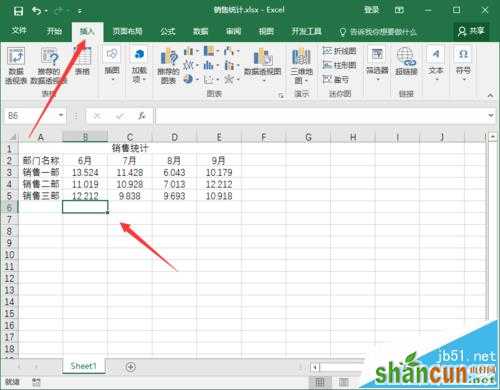
3、在“插入”菜单选项卡中,点击图表功能区的“推荐的图表”按钮选项。如图所示;
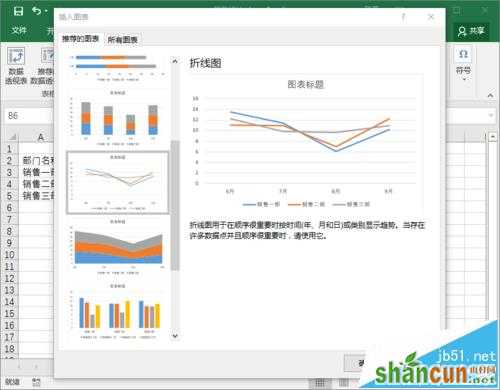
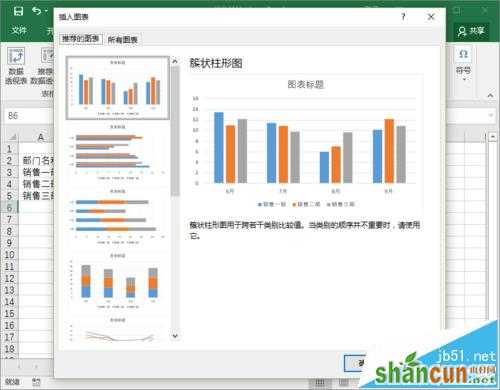
4、点击“推荐的图表”按钮选项后,这个时候会打开“插入图表”对话框。如图所示;
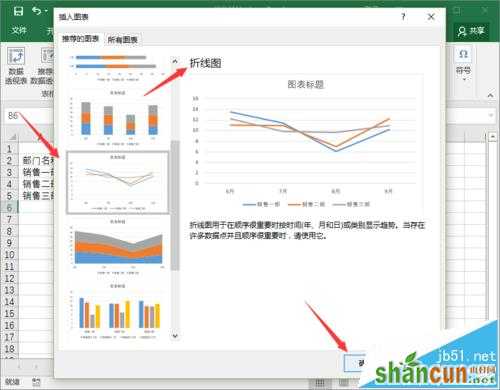
5、在“插入图表”对话框中,选中推荐的图表下的“折线图”选项,再点击“确定”按钮。如图所示;
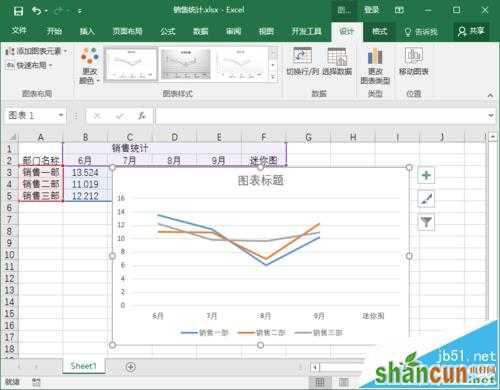
6、点击确定后,返回到Excel工作表中可看到插入的图表。如图所示;