
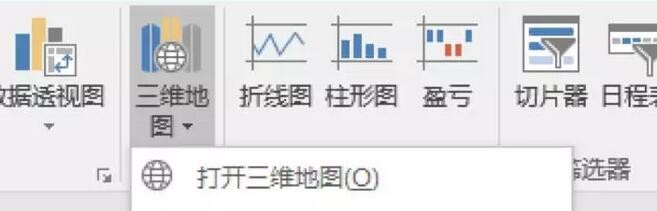
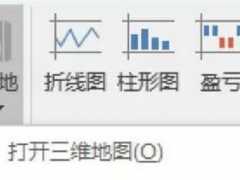
1、Excel2016 地图绘制->三维地图->打开三维地图
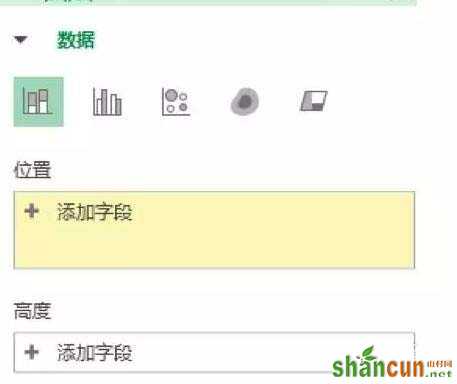
2、设置地理字段,也就是位置。
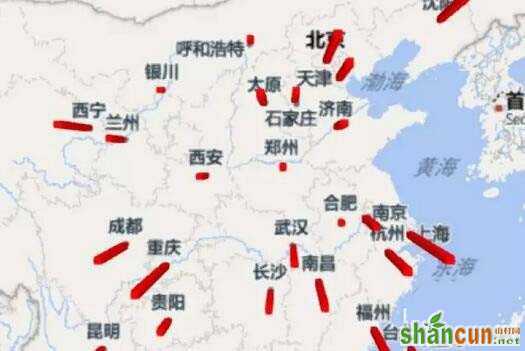
3、选择可视化图形。PowerMap提供的可视化图形有五类:堆积柱形图、簇状柱形图、气泡图、热度地图和区域。

4、设置数据字段,也就是高度。柱形图的高度也就代表数据的大小。
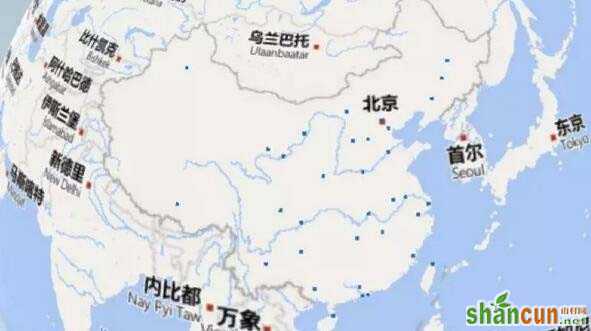
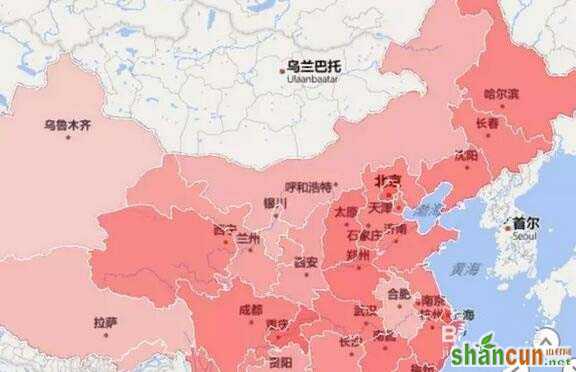
5、最常用的还是用颜色的深浅表示数值的大小。选中第五种图表类型即可。
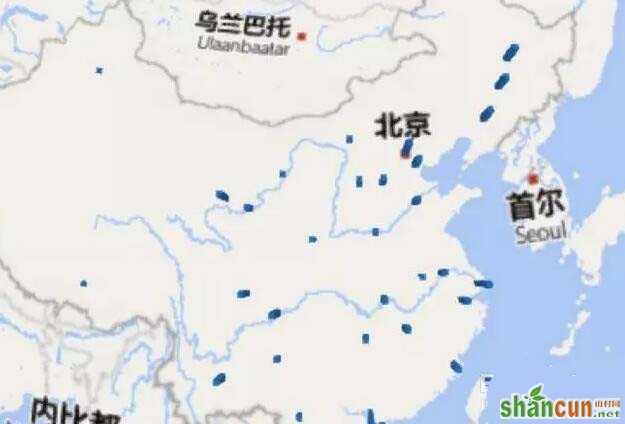
6、当然,我们也可以把图形改为平面图形,点击右上角的平面图形即可
7、当然,我们可以调节颜色等,来美化地图。
1、Excel2016 地图绘制->三维地图->打开三维地图
2、设置地理字段,也就是位置。
3、选择可视化图形。PowerMap提供的可视化图形有五类:堆积柱形图、簇状柱形图、气泡图、热度地图和区域。
4、设置数据字段,也就是高度。柱形图的高度也就代表数据的大小。
5、最常用的还是用颜色的深浅表示数值的大小。选中第五种图表类型即可。
6、当然,我们也可以把图形改为平面图形,点击右上角的平面图形即可
7、当然,我们可以调节颜色等,来美化地图。

手机看新闻


网站客服
法定工作日
8:30-17:30
微信扫描关注


