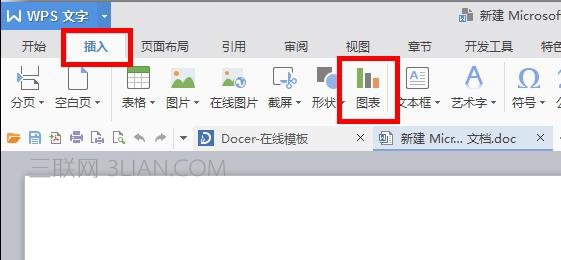
制作条形图步骤1:在Word文档的菜单栏中选择“插入”的选项,然后选择“图表”
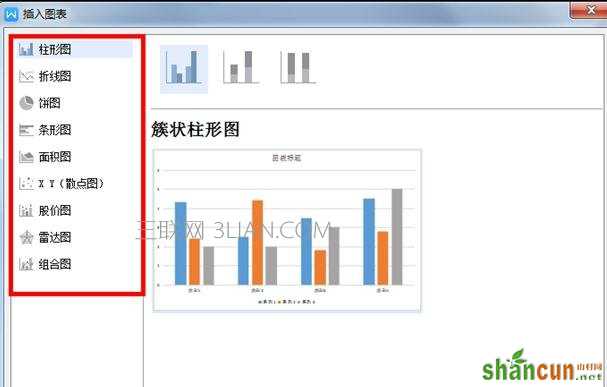
制作条形图步骤2:根据自己的需求,选择合适的图表并点击,点击完在右侧有该图表的示意图,确定无误后点击”确定“ word条形统计图怎么做
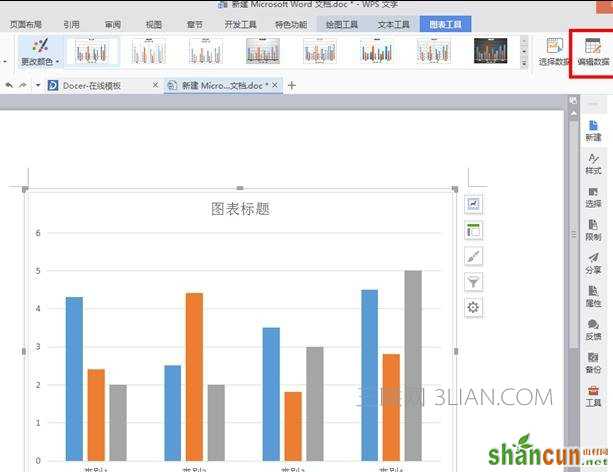
制作条形图步骤3:条形统计图主体框架已经基本完成了,这样我们还需要编辑一下条形统计图的内容,点击菜单栏中的”编辑数据“继续
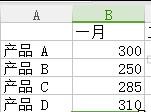
制作条形图步骤4:点击完单栏中的”编辑数据“,系统会自动打开”Microsoft Excel工作表“(看下图),然后我们可以在”Microsoft Excel工作表“中编辑自己需要的数据
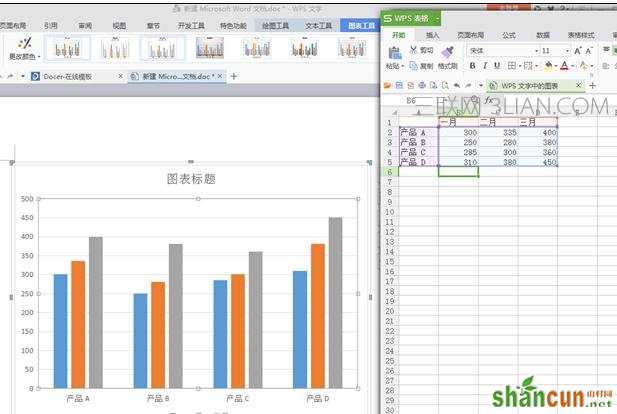
制作条形图步骤5:在”Microsoft Excel工作表“中编辑完数据后,“Microsoft Word文档”中的条形统计图会自动调整为新数据 word条形统计图怎么做