excel2007柏拉图制作步骤如下:
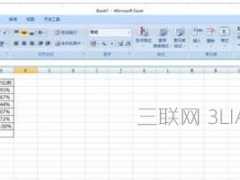
1、首先将所需要的数据处理成图中所示的表格。

2、表格里面的公式如图($可不需要,是为了下拉时锁定公式中单元格的)

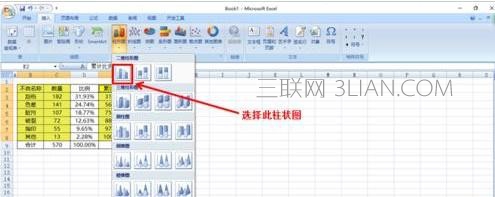
3、按ctrl选择图中黄色区域(不良名称、数量、累计比例,注意合计那一行不要选),插入→柱形图,选择二维柱形图中的簇状柱形图。
4、选择第二簇柱子(图中红色柱子,如果因为数据太小点不中就将纵坐标轴的最大值调小),右键→更改图表类型选择折线图。

5、在选择折线图,右键设置序列坐标格式,选择次坐标轴

6、将主坐标轴最大值调整为自动,再按照喜好调整和美化一下图表格式。完美的柏拉图就完成了。可以放到报告里面了。