
excel中折线图设置x轴y轴步骤:
这是制作图表所需的两组数据。
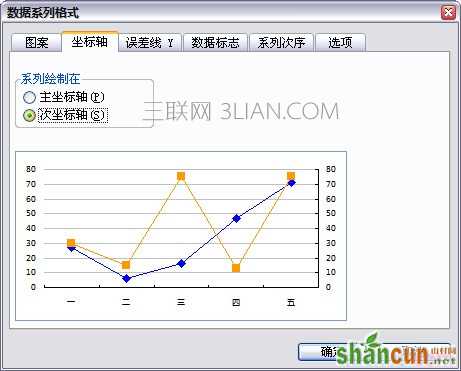
双击其中一个数据系列,在属性窗口的“坐标轴”页面,设置为“次坐标轴”
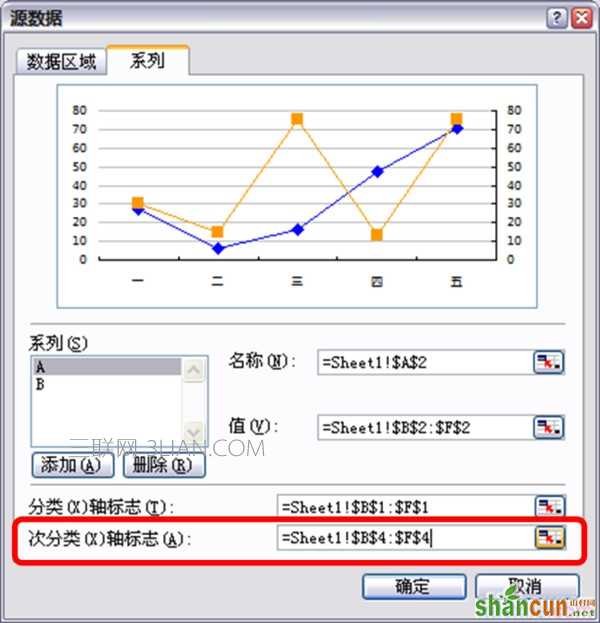
然后打开图表的源数据,在“系列”页面,指定“次分类X坐标轴”的标志引用
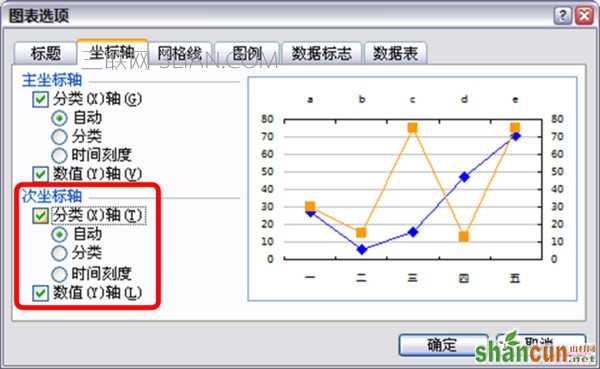
打开图表选项,在“坐标轴”页面勾选“次坐标轴”
excel中折线图设置x轴y轴步骤:
这是制作图表所需的两组数据。
双击其中一个数据系列,在属性窗口的“坐标轴”页面,设置为“次坐标轴”
然后打开图表的源数据,在“系列”页面,指定“次分类X坐标轴”的标志引用
打开图表选项,在“坐标轴”页面勾选“次坐标轴”

手机看新闻


网站客服
法定工作日
8:30-17:30
微信扫描关注


