关于Excel2010怎么利用数据描点画图的问题解答
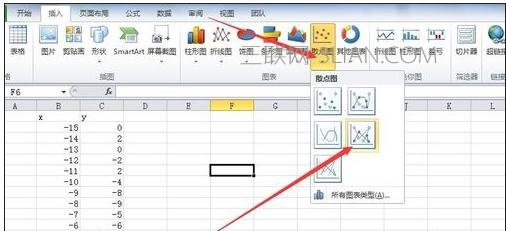
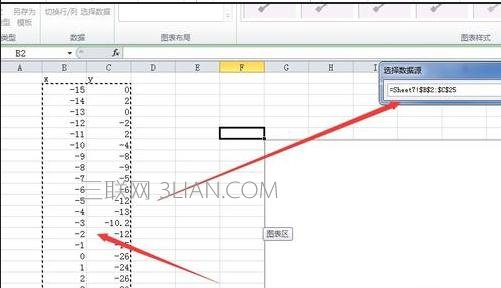
利用数据描点画图步骤1:将数据点坐标在工作簿中录入,一般为点(x,y)形式,体现在Excel中可以是两列数据。附图为示例中的点。

利用数据描点画图步骤2:在Excel2010中,选择插入带线的x,y散点图;
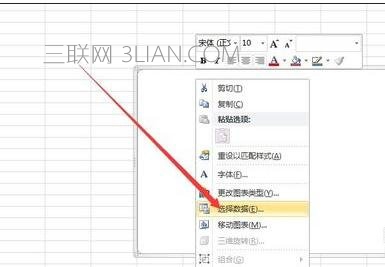
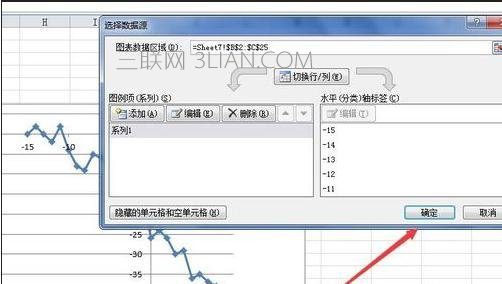
利用数据描点画图步骤3:右键→选择数据,选好数据区域后,点击确定即可生成图表。
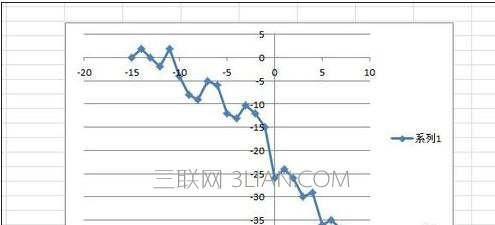
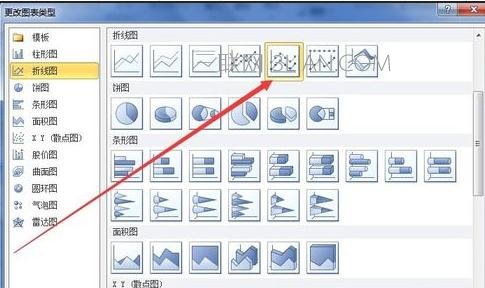
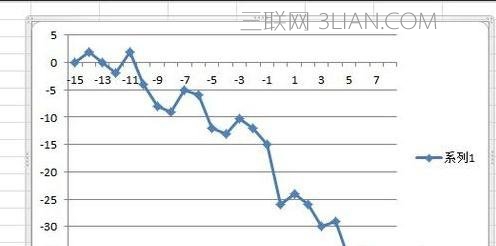
利用数据描点画图步骤4:生成的图标为附图,由于我们习惯于坐标轴在左下方,所以此时将图标类型修改为折线图(带数据的堆积折线图)即可。 Excel2010怎么利用数据描点画图