更改图表布局的步骤如下:
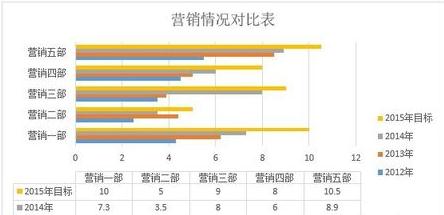
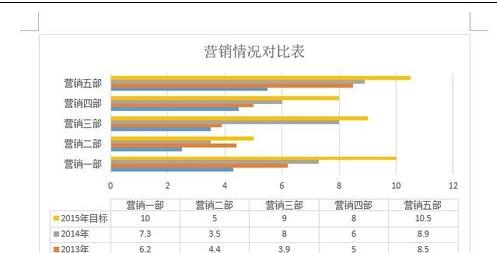
步骤一:例如Word文档中插入了如下图所示的图表。
说明:插入图表的操作可以参考小编写的“Word2013如何插入图表”。
步骤二:快速调整布局
(1)在图表上单击,选择图表。
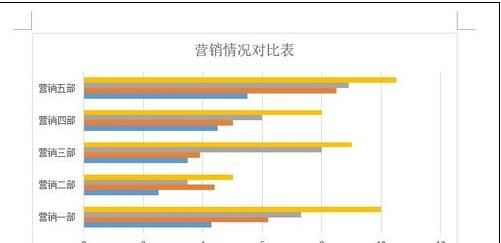
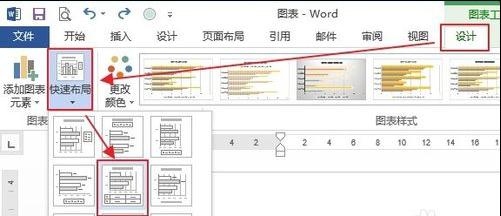
步骤三:快速调整布局
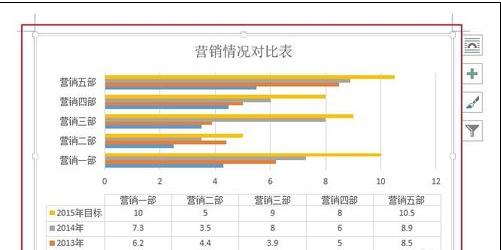
(2)在“设计”选项卡,单击“快速布局”,然后在列表中选择需要的布局即可,例如选择“布局5”。
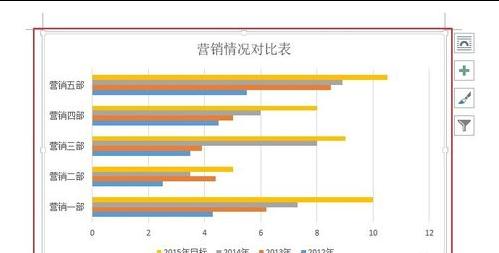
步骤四:快速调整布局
(3)效果如下图所示。
步骤五:自定义布局
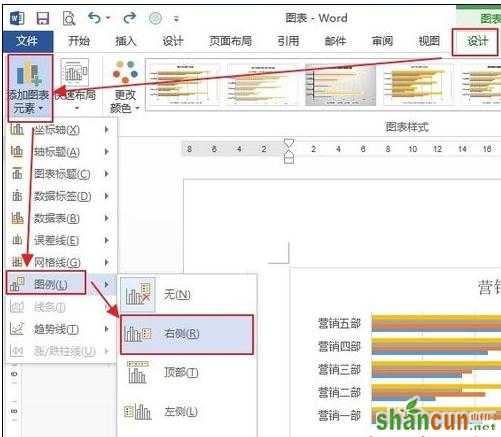
可以设置坐标轴、轴标题、图表标题、数据标签、数据表、误差线、网格线、图例、线条、趋势线、涨/跌柱线等。
下面以给上图所示的图表添加图例为例给大家介绍。
(1)在图表上单击,选择图表。
步骤六:自定义布局
(2)在“设计”选项卡,单击“添加图表元素”,然后在列表中选择需要的元素,例如选择“图例”,然后选择图例位置。
步骤七:自定义布局
(3)效果如下图所示。