
1、在Windows7系统桌面上,新建一个PowerPoint2010空白文档,并重命名“散点图.pptx”,如下图所示:
2、双击“散点图.pptx”,打开PowerPoint,如下图所示:
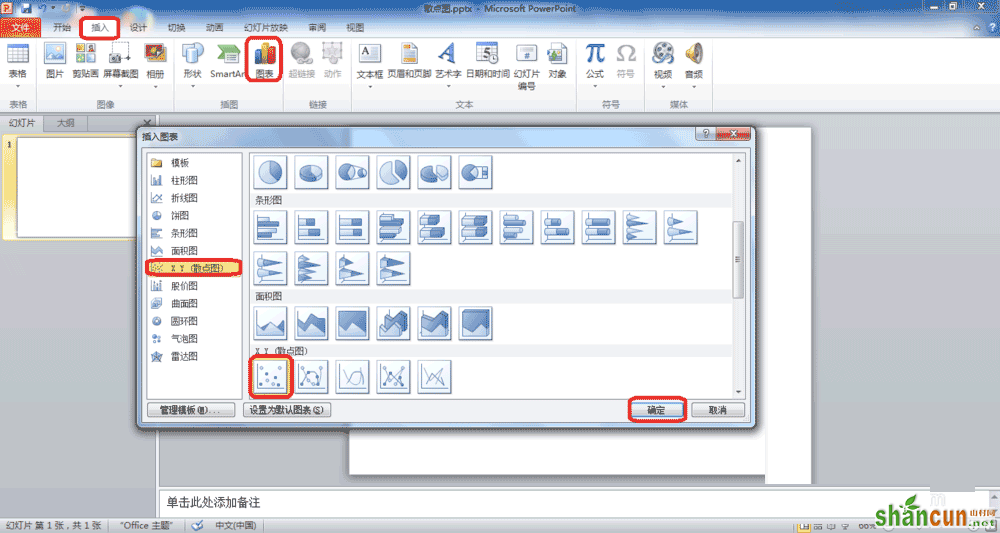
3、在菜单栏中,找到“插入--->图表”,单击打开“插入图表”窗口,找到散点图模板,选择默认的,单击“确定”,如下图所示:
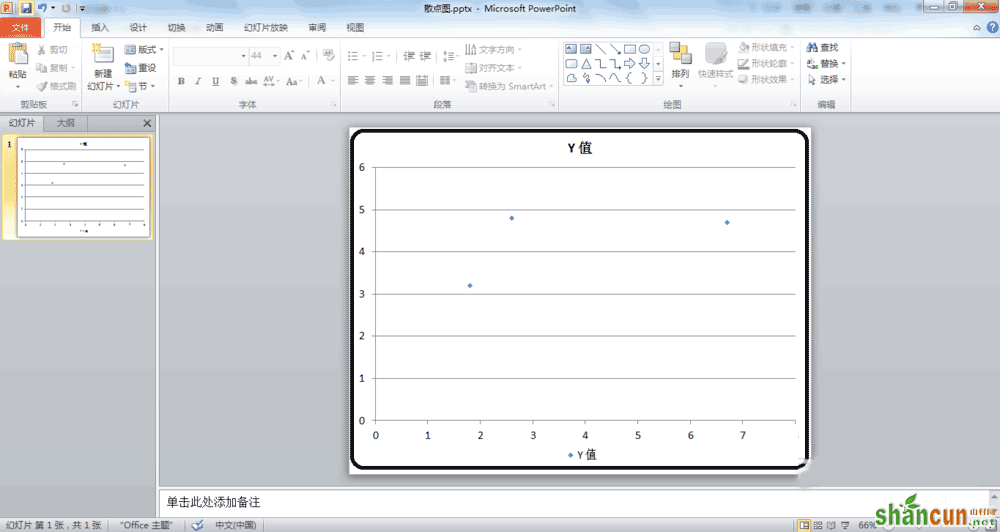
4、这时,会弹出一个Excel文档,而这个文档是提供给PowerPoint中散点图的数据源,如下图所示:
5、可以修改数据源以及标签,使图更有代表意义,如下图所示:
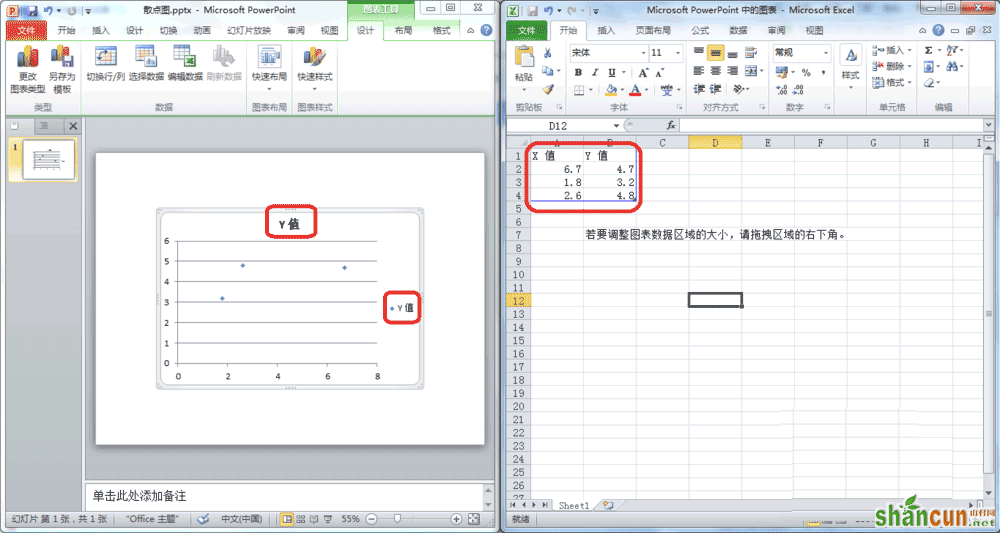
6、关闭Excel文档,修改散点图相关的属性,可以让图更美观,如下图所示:


