
我们在日常使用电脑制作ppt的时候,经常需要用到各种柱形图,如果我们需要在ppt中插入可编辑的柱形图表,那么,应该如何插入呢?下面给大家分享在ppt添加可编辑的柱形图表教程,不懂的朋友会请多多学习哦。
在ppt添加可编辑的柱形图表教程
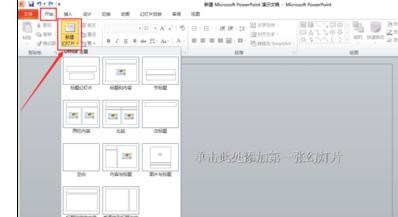
首先,我们需要在电脑上利用新建一个ppt,打开新建的ppt,找到“开始-新建幻灯片”如图所示。
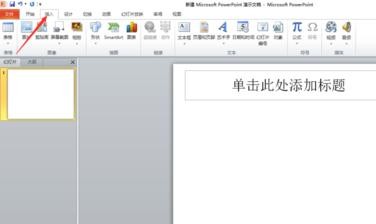
新建幻灯片以后,我们需要在ppt上方的功能菜单选项中找到“插入”的菜单,点击这个功能菜单,如图所示。
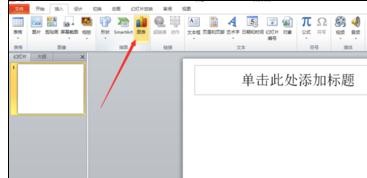
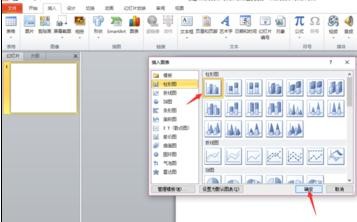
点击“插入”后,会弹出一个工具栏,工具栏里里面有多个不同的选项,比如,表格、图片、图表、文字等,我们点击“图标”,如图所示。
点击“图表”后,出现了一个窗口,在窗口里选择“柱形图”,如图所示。
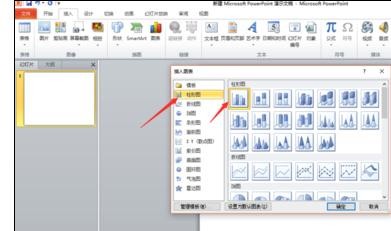
在“柱形图”里,默认的是“族状柱形图”,然后点击“确定”按钮,如图所示。
点击“确定”按钮后,会弹出一个柱形图表和一个excel表格,如图所示。
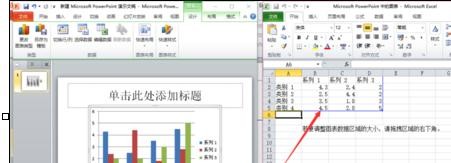
在弹出的excel表格里,输入我们想要的数据,把我们不要的格式删掉,如图所示。
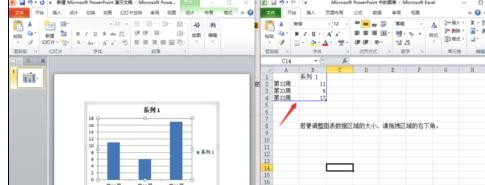
调成我们想要的个时候,关闭所编辑的表格,就会回到我们原来的ppt里,如图所示。
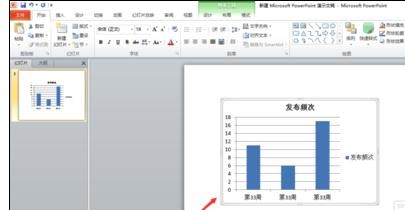
关闭表格后,点击ppt里面的柱形图,右键会弹出一个对话框,在对话框里找到“添加数据标签”,如图所示。
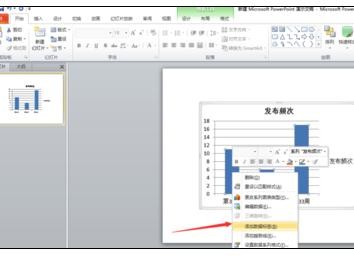
点击ppt里面的柱形图,右键会弹出一个对话框,在对话框里有一个“编辑数据“,这时我们发现,原来的柱形图可以直接在ppt里面编辑了,如图所示。


