
三线表看起来简单明了,又突破了普通表格死板,拘束的原则,很受很多朋友的欢迎,但是还有部分朋友不知道怎样在PPT中制作三线表,如何在ppt做三线表?下面给大家分享ppt做三线表的方法吧,欢迎大家来到学习。
ppt制作三线表的方法
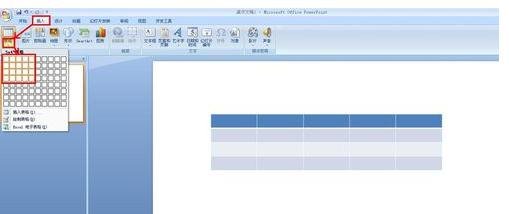
1. 新建一个PPT文档,单击菜单栏“插入”——表格——选择行列。
2.把光标移动到表格左边框外面出现十字箭头时双击,在菜单栏“设计”中选择一种底纹。
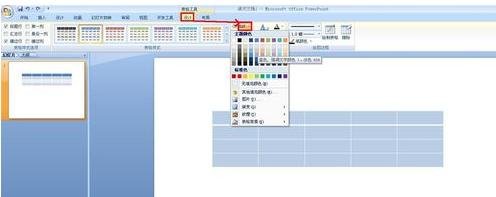
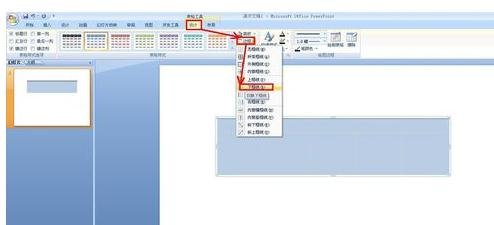
3.在菜单栏“设计”中在“边框”下拉选项中选择“无边框”。
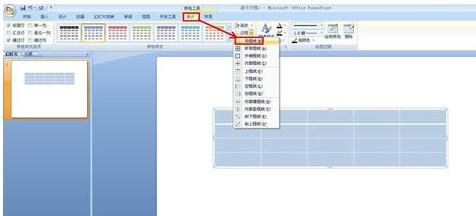
4.在菜单栏“设计”中在“边框”下拉选项中选择“上框线”。
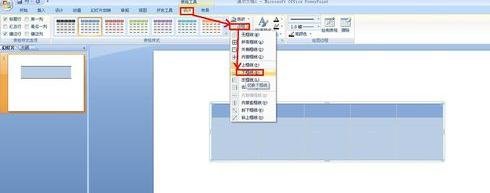
5. 在菜单栏“设计”中在“边框”下拉选项中选择“下框线”。
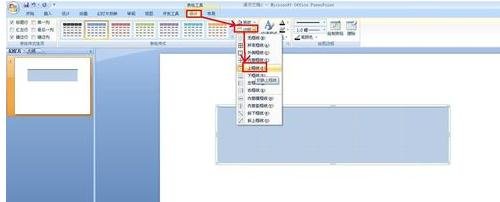
6. 选择第一行表格,在“设计”中在“边框”下拉选项中选择“下框线”。
7. 现在就可以看到三线表了,如图所示。


