
大家在使用office2010做PPT的时候不知道office2010怎么在PPT图表的插入及图表图案填充效果,其实方法很简单哦,只要在office2010PPT里找到图表就可以选择图表图案填充效果了哦,下面就和小编一起来看看吧。
office2010在PPT图表的插入及图表图案填充效果方法:
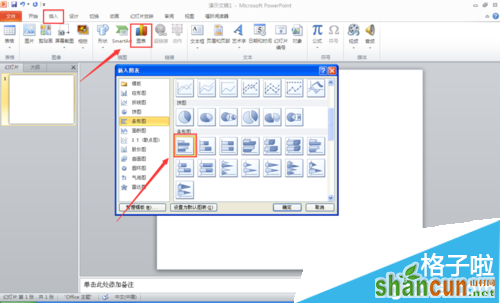
创建一个空白的ppt,点击“插入”选项卡,找到“图表”,可以根据需要插入各种类型的图标。本例插入一个条形图。
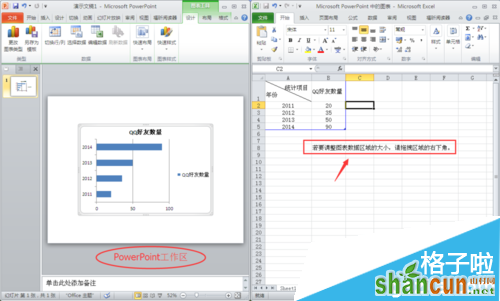
选择条形图后,自动弹出excel工作区,可以创建并输入表格数据,或者直接打开一个表格,选择数据区域。根据提示,通过拉伸调节选择需要的数据区域。
同时左侧PPT中可以预览条形图。
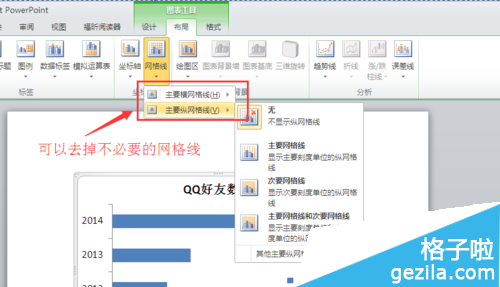
对图表做进一步的编辑与调整。
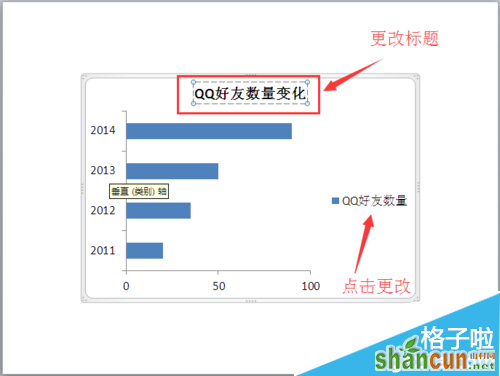
双击或右键图表就可以显示图表工具。可以去除网格线,看着清爽简约;修改合适的标题、图例等。
图表的图案填充:
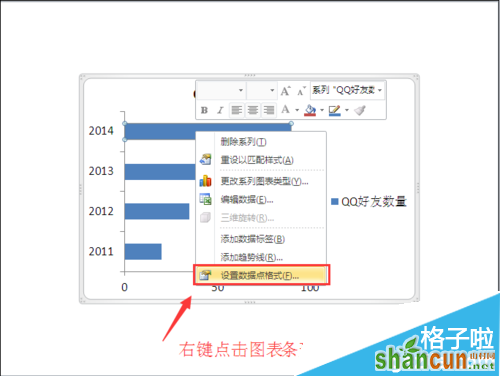
在图表条形图上右键,选择“设置数据点格式”,进行图案填充。
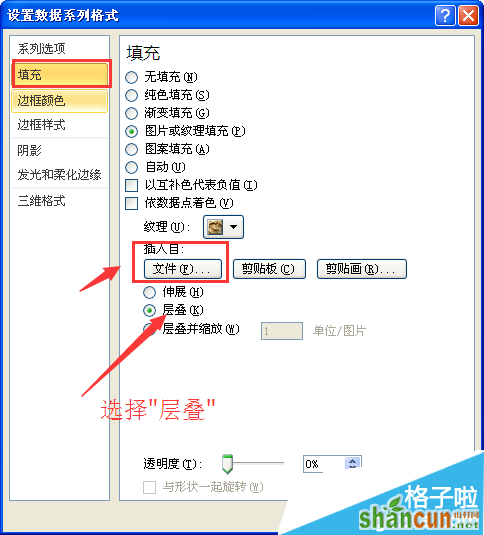
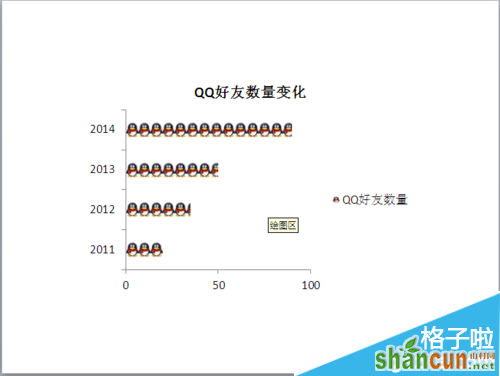
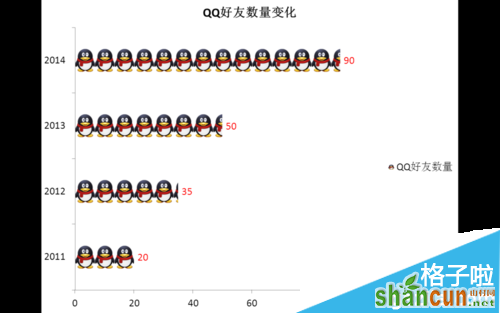
选择一张图案(图案内容要与图表显示信息有关),如图。
注意选择“层叠”才会有图中的效果哦。
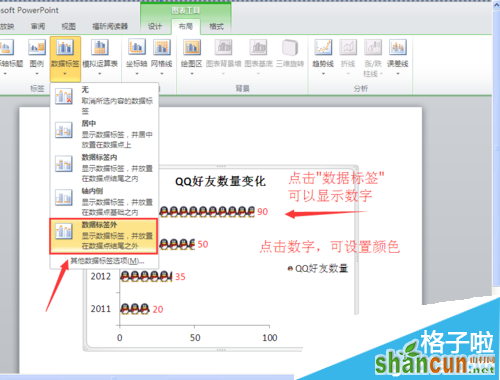
另外,如果觉得数据不清楚是多少,可以设置显示“数据标签”。
如图,在条形图后就显示数据了。
注:更多精彩教程请关注山村办公软件教程栏目,山村电脑办公群:189034526欢迎你的加入


