powerpoint2007分析图表怎么制作
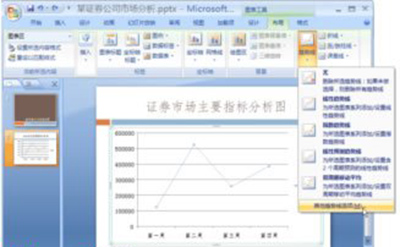
①打开PPT演示文稿后,选中分析图表,切换到“图表设计”-“布局”选项卡中,在“分析”组中单击“趋势线”按钮,在打开的下拉列表中选择“其他趋势线选项”菜单项。
powerpoint2007
②弹出“设置趋势线格式”对话框,单击“趋势线选项”按钮,在“趋势预测/回归分析类型”组合框选中“多项式”单选按钮;在“趋势预测”组合框中设置倒推2.0个周期。

powerpoint2007
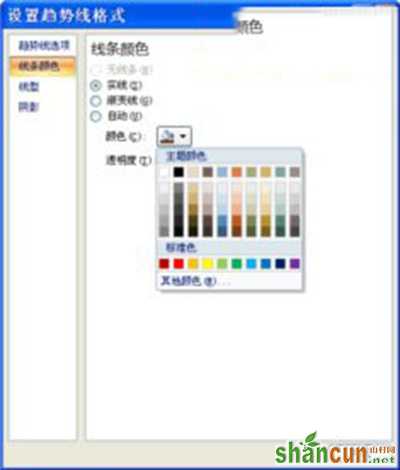
③接着单击“线条颜色”按钮,选中“实线”单选按钮,并设置线条颜色为“橙色”,然后单击“关闭”按钮完成设置。
powerpoint2007
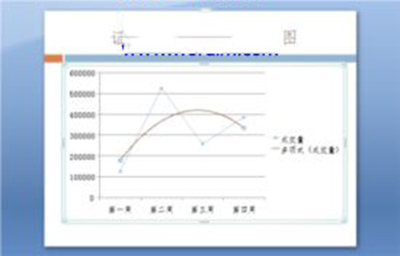
④设置完成之后的效果如下图所示。