在ppt中制作柱形图的方法:
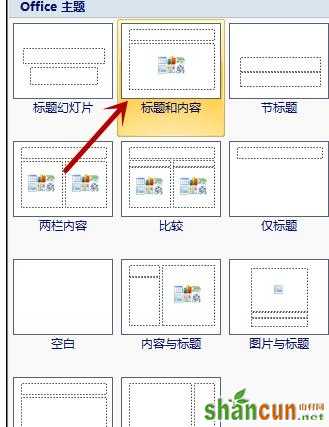
首先,打开PPT文件。点击开始选项卡中的“新建幻灯片”,如图所示。

在“新建幻灯片”菜单中,点击“标题和内容”,如图所示。
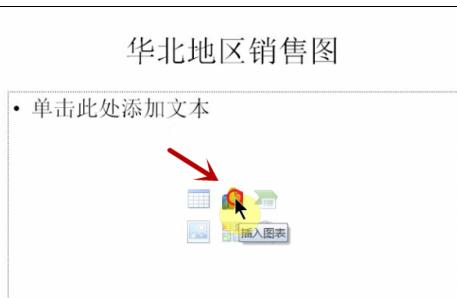
在幻灯片编辑区域点击“插入图表”,如图所示。
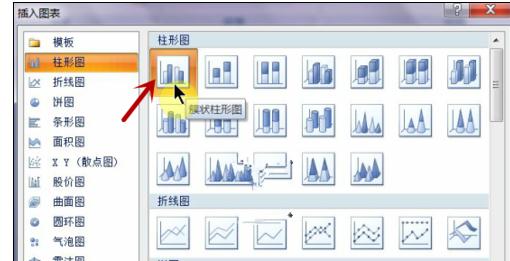
在弹出的“插入图表”对话框中,单击插入“簇状柱形图”,如图所示。
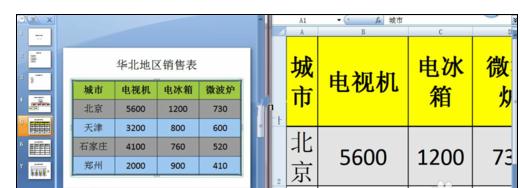
此时会自动打开一个相应的Excel表编辑区域。
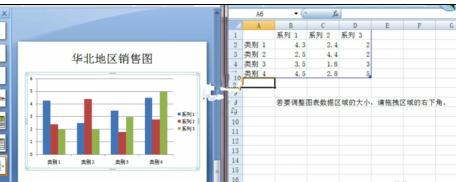
我们可以把原先准备的Excel表中的内容复制到这张表中,如图所示。
簇状图雏形就出现了,如图

选中图表,在“设计”选项卡中点击“选择数据”,如图所示。

在弹出的窗口中选择“确定”,如图所示。