
将WPS表格的数据制作成图表的方法
将下面的一组数据转为图表,如:柱形图~
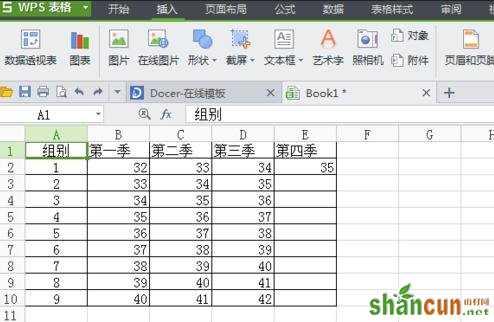
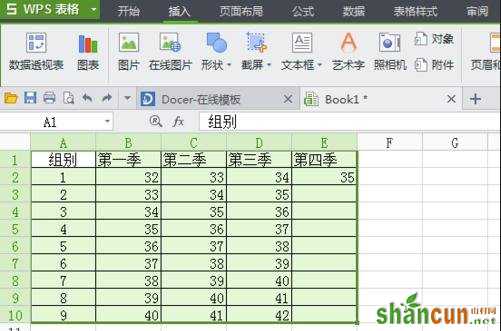
将下面的数据全选~
点击“插入”栏中的“图表”~~
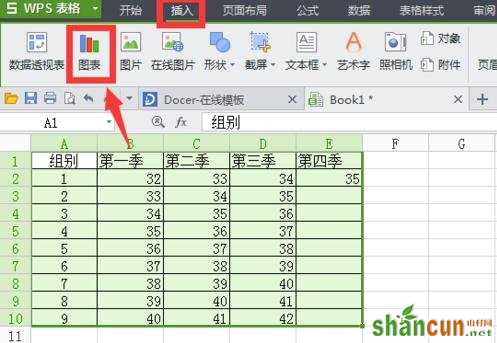
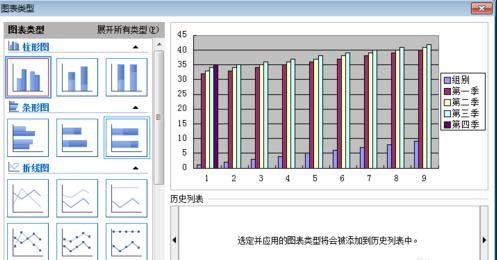
我们可以将数据变为各类图表,比如“柱形图”~~~

选择,进行下一步~
选择数据的区域,进行下一步~

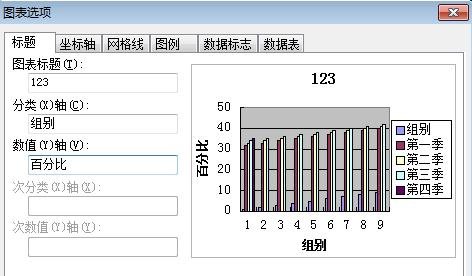
填写好图表的名称~~
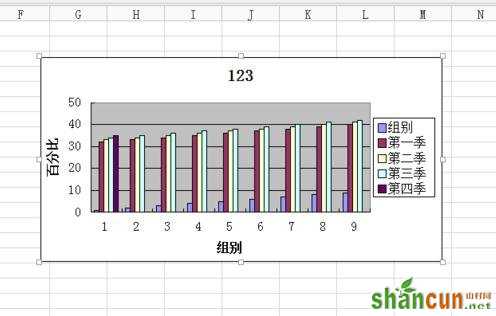
柱形图效果如图~~
将WPS表格的数据制作成图表的方法
将下面的一组数据转为图表,如:柱形图~
将下面的数据全选~
点击“插入”栏中的“图表”~~
我们可以将数据变为各类图表,比如“柱形图”~~~
选择,进行下一步~
选择数据的区域,进行下一步~
填写好图表的名称~~
柱形图效果如图~~

手机看新闻


网站客服
法定工作日
8:30-17:30
微信扫描关注


